Understanding SQL Server Query Store
April 1st, 2016Query Store was introduced in SQL Server 2016 and on Azure SQL DB v12 as a way to track query execution statistics. When Query Store is enabled it will save the query SQL text, the execution plan and execution stats like number of executions, elapsed time, logical reads etc. The information is persisted in the database and allows for later analysis. Query Store should be the first stop for anyone doing performance analysis on SQL Server. Developers need to know about Query Store in order to identify the problem spots early and focus on improving the application performance by improving the queries that will yield the bigger impact. DBAs need to know about Query store for similar reasons to understand the performance bottlenecks, but also to understand the actual workload executed on a server.
Prior to Query Store performance and workload analysis relied primarily on DMVs like sys.dm_exec_query_stats and sys.dm_exec_procedure_stats. These DMVs are based on the query plan cache and as such they have some drawbacks:
- they do not capture all queries as some query plans are never cached
- the query stats are lost when entries are evicted from query plan cache
- the stats are not available over long time
Query Store resolves these drawbacks by persisting the execution stats in the database and improves over the information in these DMVs with more features, efficient storage and better information structure. Query Store has no relation whatsoever to the query plan cache, it captures all queries even those that are never cached.
How to use Query Store
Query store needs to be enabled on each database you desire to capture execution stats. This is achieved by running the following:
ALTER DATABASE
Once Query Store is enabled all statements that execute in the context of that database are going to be captured.
The information captured by Query Store is exposed in a series of new catalog views:
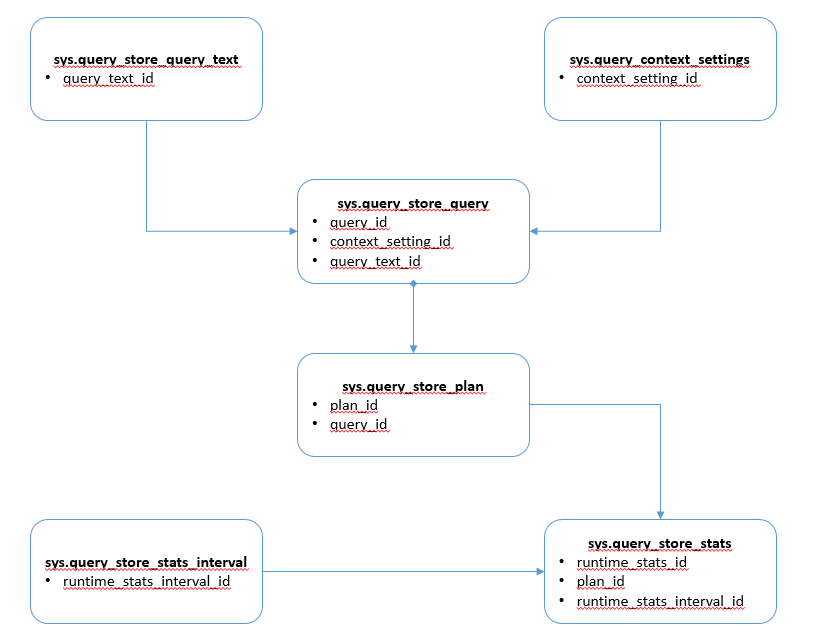
- sys.query_store_query_text
- This view exposes the individual statements (queries) captured by Query Store. The text is captured exactly as sent to execution, including comments inside the statement. Each query text captured by Query Store will appear once in this view.
- sys.query_context_settings
- This view exposes the context settings under which a query was executed. Context settings capture information like the various session SET options in effect, date format settings and more.
- sys.query_store_query
- This view exposes the individual queries captured by Query Store. A “query” in this context is a combination of one query text and one context settings, in other words is the query text executed in a specific context setting.
- sys.query_store_plan
- This view exposes the query plans captured by Query Store. A query can have multiple execution plans.
- sys.query_store_runtime_stats_interval
- Execution statistics are saved periodically and aggregated for intervals. This view exposes the intervals for which Query Store has captured execution statistics.
- sys.query_store_runtime_stats
- This view exposes the actual runtime statistics captured by Query Store for each plan executed, aggregated per interval.
How Query Store works
In the Understanding how SQL Server executes a query article I explained some of the internals of how SQL Server executes queries. We can take execution workflow picture and annotate it with Query Store specific information:
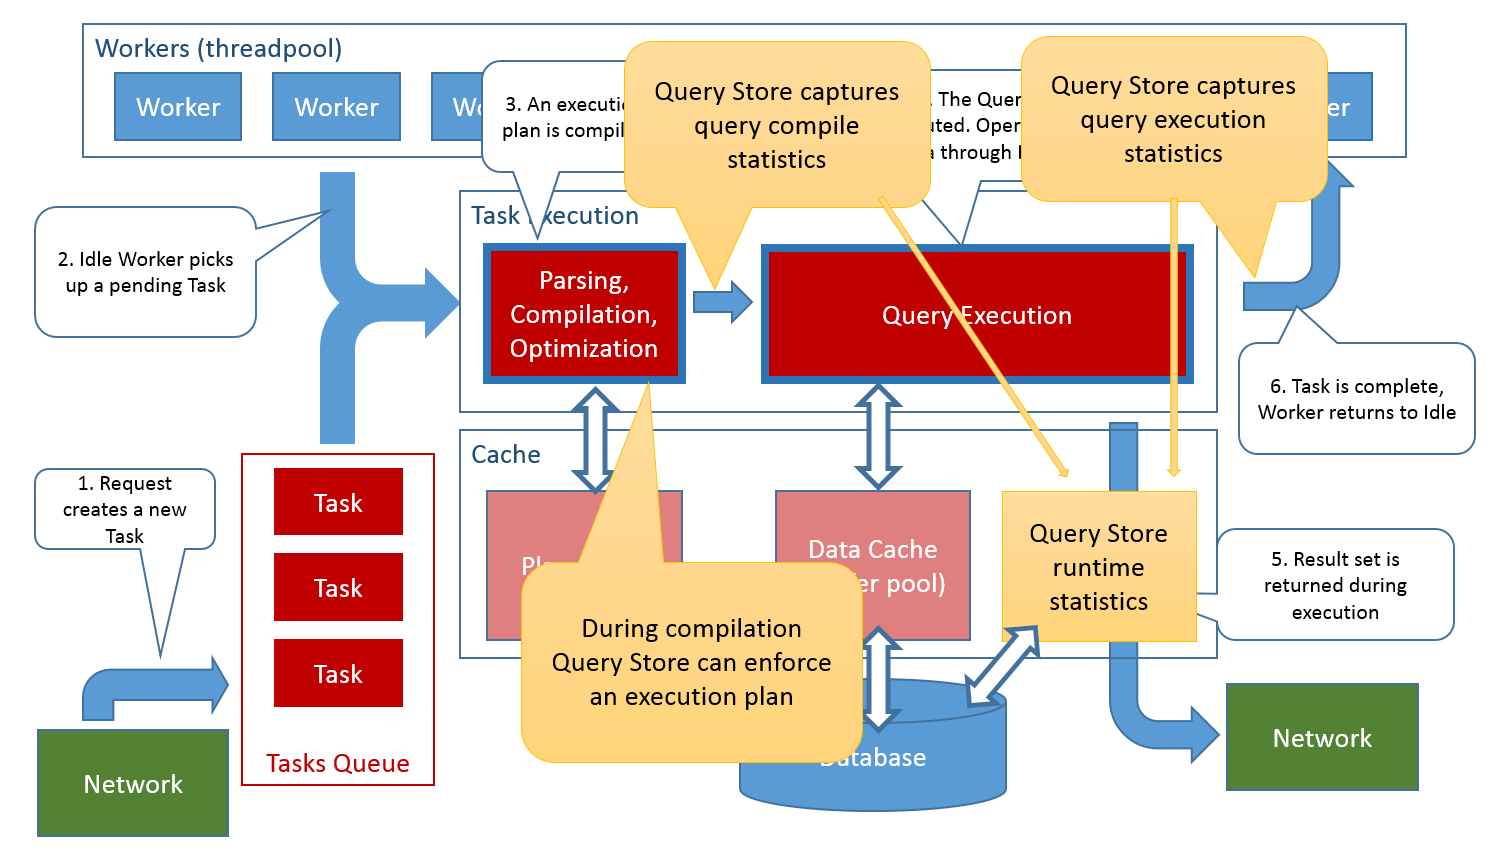
Query Store is notified of compilation duration after each statement compilation, and execution stats after each statement execution. Query Store caches the stats in memory and aggregates them for each query and plan. Periodically it will flush the accumulated statistics into the database. The frequency of flushing the stats depends on the INTERVAL_LENGTH_MINUTES Query Store option:
Determines the time interval at which runtime execution statistics data is aggregated into the query store. To optimize for space usage, the runtime execution statistics in the Runtime Stats Store are aggregated over a fixed time window. This fixed time window is configured via INTERVAL_LENGTH_MINUTES.
Query Store catalog views will always show the latest data
Querying any of the Query Store catalog views is guaranteed to show all captured statistics, including the latest ones not yet flushed to disk.
Performance impact of enabling Query Store
Probably the most frequent question I hear when I’m talking about Query Store is “OK, but how much does it impact my performance?”. The short answer is “you won’t notice it”, but lets details a bit. Having Query Store enabled will impact several aspects:
- Disk space used to store the Query Store captured query text, plans and execution statistics
- Disk IO to save and update the above
- Runtime CPU for Query Store
- Memory consumed by Query Store
Disk Space used by Query Store is configurable via the MAX_STORAGE_SIZE_MB setting. This is space used in the database on the primary filegroup. The on-disk size of the Query Store data does not directly affect performance except when Query store has to load this data. After a database startup Query Store has to reload in memory the query text hashes and the plan hashes from the sys.query_store_query_text and sys.query_store_plan catalog tables. This load takes longer the bigger the Query Store size is, you should allow for something like 1 second per 1GB of Query Store data. Note that as SQL Server does not have a database quota system is possible for Query Store to actually exceed the configured maximum space, but it should only exceed it by very small amounts.
Disk IO required by Query Store will have a direct impact on your system performance. Disk IO is the most precious resource on any database system, when the disk IO is the bottleneck then anything that diverts IO will impact performance and Query Store is not exception. Query Store issues IO to write the query text and the query plan and when flushing accumulated aggregated execution stats. Query Store always saves the data asynchronously in background tasks, so the user workload is not impacted directly.
Query Store avoids using high CPU on the query execution code path, and Query Store structures are partitioned to avoid CPU interlocked hotspots. However when a new plan is captured by Query Store the query plan has to be generated, which implies walking the statement execution tree and generating the showplan XML. This is relatively expensive, but as it usually occurs in the compilation phase it should not impact the overall performance of a well tuned application.
Memory consumed by Query Store is dependent on the number of queries and plans present in your workload. Query Store memory can become significant factor if you execute hundreds of thousands of distinct queries. Query Store takes measures to prevent excessive memory use, like limiting the number of distinct plans captured per query.
Overall you should consider that Query Store typically adds an impact on performance in the range of 0.5% to 2.5%, meaning that if your system has a throughput of X transactions per second it will reduce that throughput by 0.5-2.5% if Query Store is enabled
The better your application is written, the lower the impact of enabling Query Store
Typical OLTP applications contains a small number of well tuned queries, executed with high frequency. In such environments Query Store quickly captures all the query texts and plans and will only have to capture the execution stats and periodically flush the aggregated execution stats to disk. This is the most optimal Query Store resource usage: low disk space used, low CPU and memory consumed, low disk IO required. Impact on the workload is minimal. Typical OLAP and DW applications run frequent ad-hoc queries, each query take significant resources to compile and execute and is executed seldom. In such environment Query Store requires more resources as it has to save more often (and bigger!) query texts and query plans.
Applications that use embedded literals in the query text (eg. SELECT ... FROM ... WHERE id=1) instead of parameter (eg. SELECT ... FROM ... WHERE id=@id) will be more impacted by Query Store. Embedding literals is an anti-pattern and has more negative effects, but with Query Store it will transform almost every execution into a distinct query text, and this triggers a new query, and a new plan. As each of these distinct queries and plans has to be saved to disk, disk space usage and disk IO consumed by Query Store skyrockets. In such situations, when you analyze Query Store you will see lots of different query texts, different queries, different plans, but very few plan shapes (different plans entries in sys.query_store_plan that represent the same actual execution plan can be identified by the query_plan_hash column value). For such workloads is recommended to enable forced parameterization. I know some consider the topic of parameterization anathema, but I strongly stand by this recommendation, even unrelated to Query Store.
MSDN has good coverage of Query Store, you should start by reading Monitoring Performance By Using the Query Store.